I’m addicted to spreadsheets. This is due to my love for numbers, statistics and graphs; basically, anything that is a fact. Due to this, I track everything. When I say everything, I mean everything. From how many miles my car has driven to the last tank filled up, how much a tank of petrol cost and the number of litres I got from it. To how many calories I eat a day and the amount of coffee I drink. To the number of hours I sleep, every time I walk Marty (my dog). I could go on and on.
Why I’m guessing you are thinking?
There are 3 main reasons:
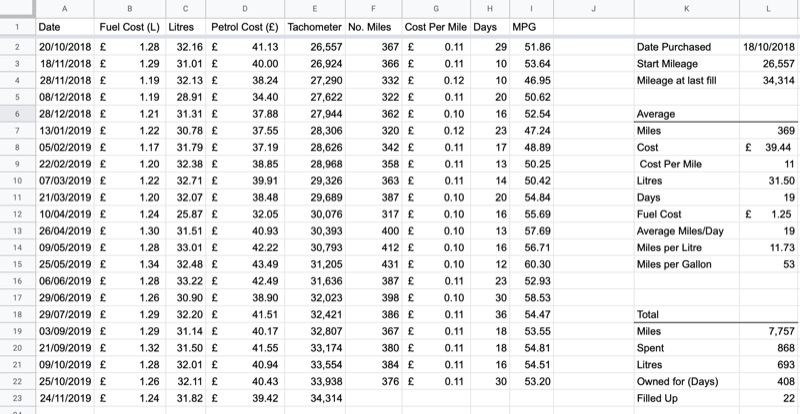
- The first reason is that it gives me valuable and useful information. For example, because I track everything about my car; I can tell you exactly how many miles I have done since I got the car, how many days I have owned it, the average miles per gallon my car does to see how well I am driving it. The fluctuation in petrol prices and how many days a tank of petrol lasted.
- The second reason is that it allows me to track my life and look back in the years to come and see what I did when I did it and how many times I did that particular thing.
- The final reason is just because I can.
Let me also note that nearly everything that I track with my spreadsheet is automated to an extent meaning I rarely add anything manually. This saves me a lot of time and also allows me to set it up and then not worry about the spreadsheet until I want to look and check the stats.
Here is a list of everything I currently track:
Total & Averages
- Days tracking
- Hours of sleep
- Number of coffees
- Calories eaten
- Dog Walks
- Hospital Visits
- Visits to the office
- Projects I’ve worked on
- Years working in web design
- Hours worked for my business
Car highest & lowest
- Fuel price
- Tank cost
- Miles on tank
- Days on tank
- Miles per gallon
As you can see, I track quite a lot of things. Some might say overkill. However, to me, I think it’s not enough. I’m always looking for new things to track. “The more information the more power you have” (I think of myself as an almighty God in the sky when I say that). With all this information you can track and predict things.
Maybe in the future, I could use artificial intelligence and machine learning to find patterns and predict things like how much money my business will make next year based on last years data.
Automating my life
There are a few different ways that I track everything. First of all, I use google sheets; this is where all the data and information that I track is collected. I create different sheets for different things. I have a main “Stats” sheet which gathers all the data from every other sheet and displays it nicely. Next, I have 2019 which groups all my tracked progress into the specified month that it was done. This allows me to see how much of something I did in each month. Next is my daily log. This is where I track the number of hours of sleep I got that day, how many coffees I had and the total number of calories I ate that day. After that, I have a log of all the hours I’ve worked for my business. There is a sheet that adds a new row every time I visit certain geolocations. The last two sheets are “car” which imports all my car data from a separate spreadsheet I have and my business which is where any data related to my business is kept. Everything is organised into a sheet and allows me to easily find something when I need it.
So I have all these sheets, how do I input and update the data? No, I don’t manually add everything.
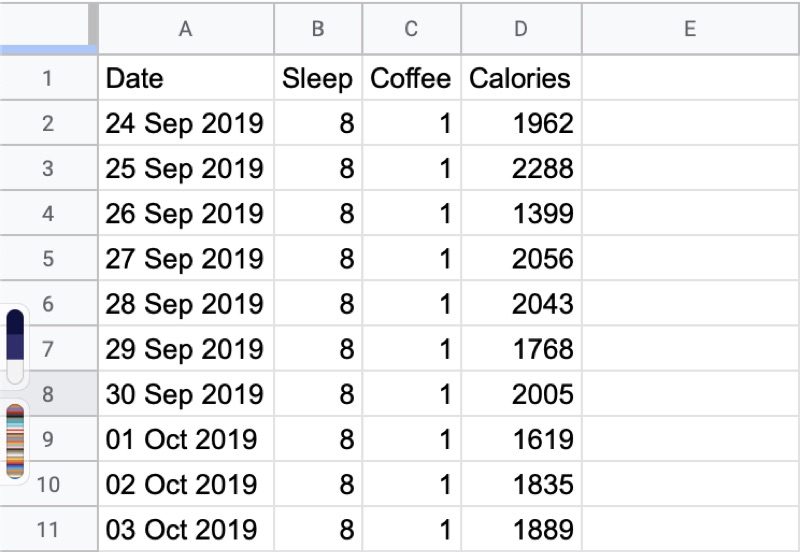
My Daily Log
My daily log uses apple shortcuts. I wrote a program that gets the current date and sets the date to the variable “date”. It then asks me “how many coffees I had today?” and puts it into a variable. Then the same thing happens for “how many hours of sleep I had”. Then the last question is “How many calories I ate”.
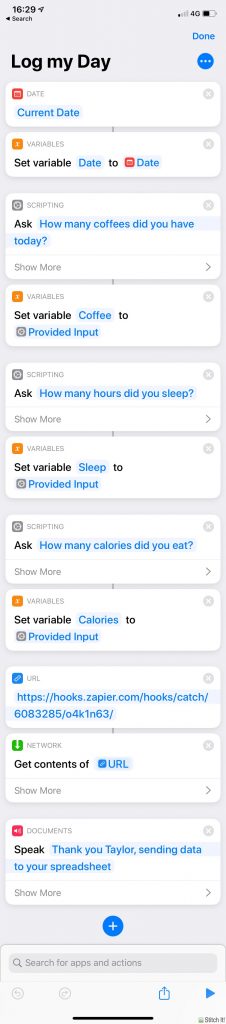
Once the program has all of this data I connect my Zapier account and use a webhook. The shortcut then gets the content of the URL and passes the variables that stored my replies to the URL which talks to google sheets and magically send the information over the internet. Just like that, they appear in my Google sheet.
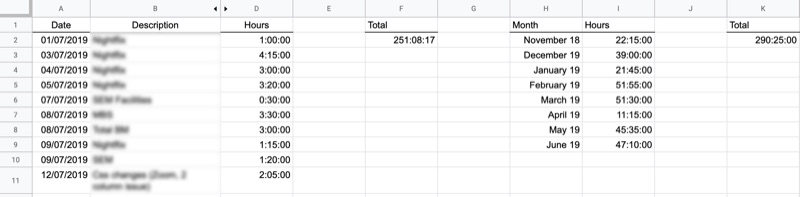
Tracking my hours and places I visit
To get my information in the sheets Toggl and places, I use an integration app called Integromat. I have two scenarios set up. The first one checks my time tracking software that I use for my business and when I add a new entry it takes the date, description and time and sends it to google sheets.
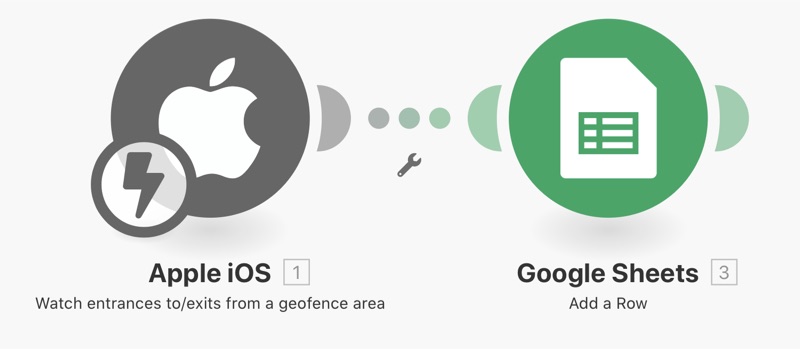
The other scenario I have is Geolocation. On my phone I set an area, so, for example, I set an area that I walk past when I take Marty for a walk. Every time I enter that location the scenario is triggered and sends the date and time and also the area that I walked into. The reason for this is it allows me to create multiple areas for different things. The other areas I have are the hospital and the office.
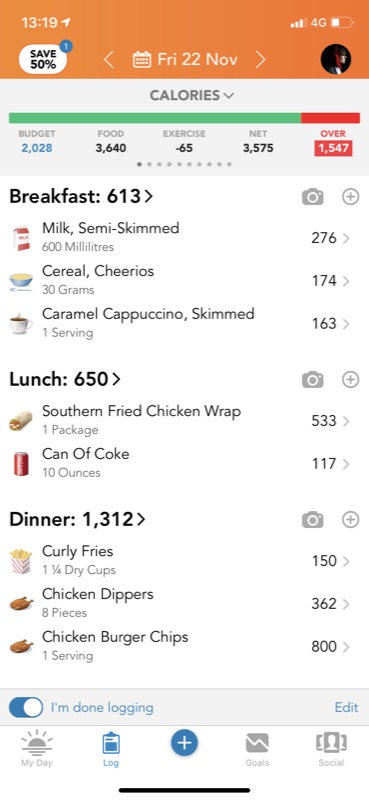
My calories
I track my calories using an app on my phone called “Lose it”. Which now that I think about it, is quite ironic for the way that I use it, as I use the app to try to put weight on. This is due to my health making it hard for me to keep weight on. Within this app, I track everything I eat and drink from breakfast, lunch and dinner. As well as everything in between. I don’t track water intake because I’m too lazy to add it as it doesn’t add any calories on.
My Car
The way I track everything about my car is a little different to everything else. I set up a separate spreadsheet and used Google’s in-built form feature.
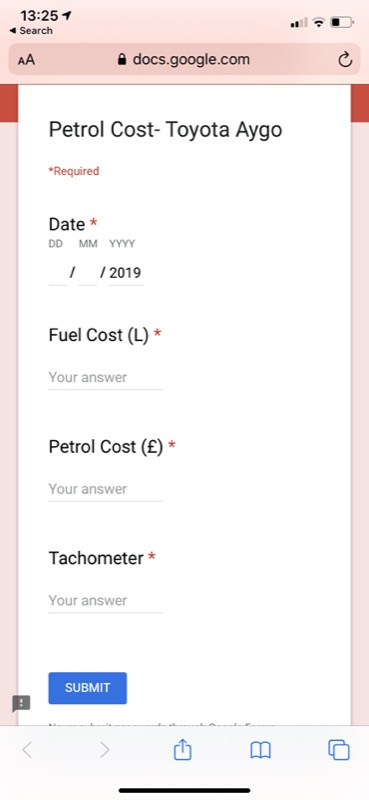
This gives me a form that asks for the date I filled up, the fuel cost per litre (IE 1.25p/l), the total cost of the tank and the number on my tachometer. Once submitted, I can then work out lots of different information just based on those four initial inputs.
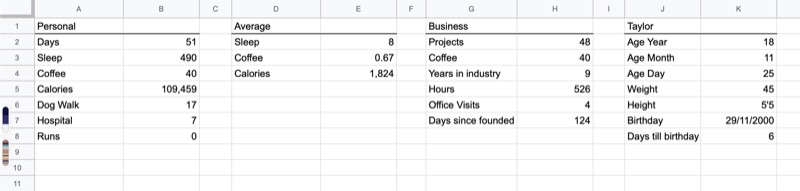
View My Stats
Using all the data and information that I’ve collected. I have put it all into one page that displays all the different things that are currently tracked for you to see.